|
|
|
CARPIUC BenchmarkAn author is not allowed to give more than one paper in mini-symposia. Printable version
CARPIUC Benchmark:
|
|
Effective water [kg/m3] |
Cement |
Sand 0/4 |
Plasticizer |
|
319 |
611 |
1235 |
5.25 |
All the specimen were stored in the same water basin at room temperature and taken out 3 to 7 days before each test. Both crack-propagation tests were performed a week apart. 3-point flexural tests performed on 40x40x160 mm specimens and compressive tests performed on the resulting broken parts of the specimens (196-1 NFEN norm [2]) give the following main characteristics:
|
Young modulus |
20.03 ± 0.005 GPa |
|
Tensile strength |
4.1 ± 0.4 MPa |
|
Compressive strength |
79.94 ± 2.9 MPa |
The Young modulus was assessed using the elastic slope of the tests, to the NFEN procedure. The Poisson ratio was not identified. The fracture energy Gf is obtained from 6 3-point flexural tests performed on 70x70x280 mm specimens (following the recommendation of [3]). It is equal to 114.6 ± 18.8 N/m. Force-displacement curves of these tests are available. For more details, see A. Carpiuc-Prisacari PhD manuscript [4].
Loadings
The test loadings consist of proportional and non-proportional combinations of three elementary displacements of the upper face of the specimen while the bottom face is fixed:
- a global tension (i.e. vertical translation)
- a global shear (i.e. horizontal translation)
- a gradient of vertical displacement (i.e. in-plane rotation)

The crack evolution is controlled by Digital Image Correlation [5], with a computation performed every 10 images to detect the advancement of the crack. When the crack is considered sufficiently propagated the loading is changed to reorient/branch the crack.
Roughly speaking, the displacement rate is 0.01 μm/s, corresponding to quasi-static loading conditions. The stable propagation(s) lasts several hours, so only the final unstable crack propagation is a dynamic event. Precise loading paths will be found in the available data.
One may summarize the two tests as:
- for the first test, an initiation of the crack, followed by several reorientations and a branching of the crack
- For the second test, an initiation of the crack from one notch, then on the other, and a final link-up between the two propagated cracks
Testing machine
The tests are performed on a 6-axis hexapod testing machine. The load capacities are roughly 120 kN & 70 kN.m along Z and 50 kN & 45 kN.m in the X − Y plane. The displacement range is around ±250 mm & ±22° along X, Y and Z. Its displacement error is less than 1 micrometre when the displacement range is limited to few hundreds of micrometres.
A small passive hexapod with legs equipped with strain gages is placed under the large one, in order to measure the forces and torques applied to the specimen. Its measurement uncertainties are equal to 80 N & 20 N.m.

Instrumentation
Displacement measurements are performed with a 2048x2048 pix. camera placed on each side of the specimen, recording images of the 200x200mm faces and the plates to which the specimen are glued. Images are synchronized and taken every 5s.

The available displacement fields are obtained with a Digital Image Correlation algorithm (Correli RT3, see [ 5 ]) with a mesh size equal to 15 pixels and a pixel equal to 130 μm. The displacement uncertainty of these kinematic field are 1.3 (resp. 2.4) μm along Z (resp. Y ) direction.
First test results presentation
For the 1st test the loading path is chosen to generate several reorientations and the branching of the crack. It consists of a series of different combinations of tension, rotation and shear steps (Fig. 2) that leads to initiation, propagation and reorientation of a crack following a zigzagged path. The reorientation is obtained by changing the shear sign while keeping the tension constant (steps n° 2, 4 and 6). The evolution of the crack at the end of each propagation step is given in Fig 5. The forces and torques measured during the test are presented in Fig. 6.
During the test the closure of the crack is observed. One may consider the crack closure to be nearly negligible because simulations performed with a non-local damage model [6] with and without stiffness recovery give good results in terms of crack path prediction in both cases. However, the force-displacement curves obtained with the model considering the stiffness recovery are closer to the experimental data than the ones obtained without any crack closure formulation (For more details, see A. Carpiuc-Prisacari PhD manuscript [4]).


Second test results presentation
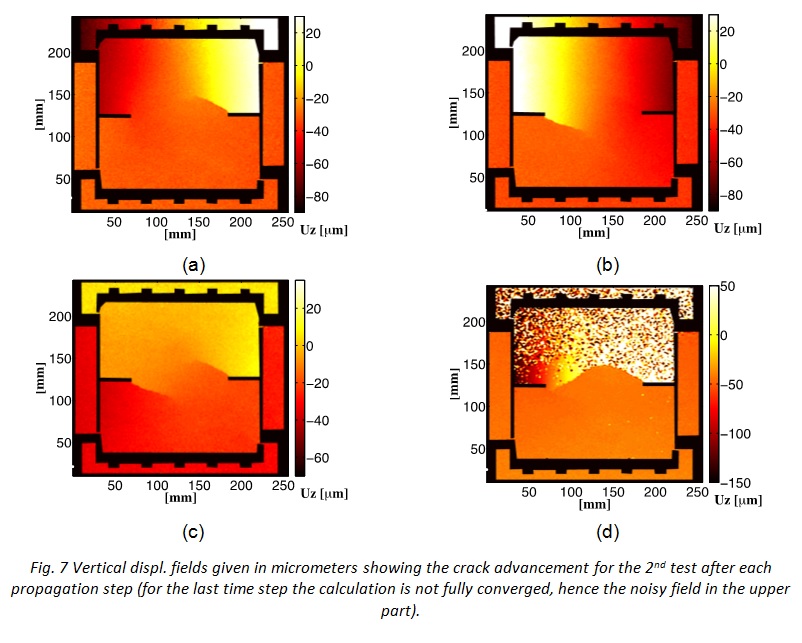
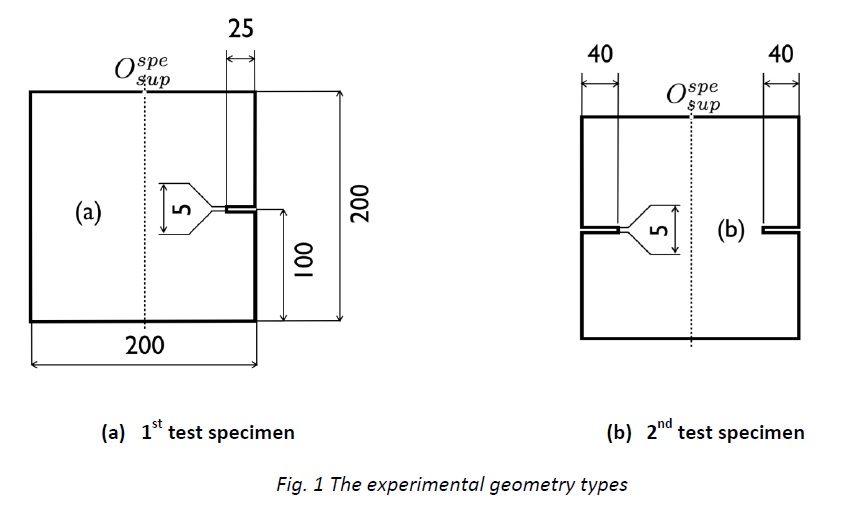
The 2nd test addresses phenomena such as successive crack initiation and propagation, crack closure and friction and crack coalescence. The chosen geometry is the one with two notches (Fig. 1b). The test can be divided into four loading steps composed of combinations of elementary loading paths like tension, shear and in-plane rotation (Fig. 2). More precisely the test starts by applying positive in-plane rotation combined with a positive shear force to initiate and propagate a crack upward. Afterward, the system is unloaded and reloaded by coupling a negative in-plane rotation with a positive shear force leading to the closure of the crack and the initiation of a second crack on the opposite notch. After a second unloading, the final step is a proportional tensile - negative shear loading that reorients both cracks and links them up. The evolution of the crack after each propagation step is given in Fig. 7 and the evolution of the measured forces and torques is given in Fig. 8.
Even though during the propagation of the second crack, the first one is submitted to a small compressive displacement, when comparing the crack paths predicted by a non-local damage model [6] considering crack closure with those predicted without the crack closure formulation, almost no difference is noted. The forces and torques are also close for both formulations (for more details, see A. Carpiuc-Prisacari PhD manuscript [4]). Therefore, the data can be simulated with models that do not consider the stiffness recovery.


Input data and how to
The given boundary conditions and the crack path evolution are given for one face of the sample and are suited for 2D numerical simulations, the data from the second face will be provided in order to be able, if desired, to perform 3D numerical simulations. Data are not restricted to some key moments of the tests, but are on the contrary available for a very large number of time steps from the beginning to the end of the loading.
In order to exclude any issues when modeling the loading plates and the glue layer, the DIC mesh node displacements corresponding to a resized sample of 200 x 150 mm are extracted and applied to the finite element model on its boundaries (Fig. 9). Therefore, the numerical geometry must be 200 x 150 mm (respectively 50 x 200 x 150 mm for 3D simulations).

For each face of the sample two “Boundary conditions” files will be provided, one containing the displacements to be applied to the lower boundary of the sample and the other one containing the displacements for the upper one. Each "BoundaryConditions" file will be structured in 3 columns:
Column 1: The width coordinate (y axes) corresponding to the displacements values, given [mm] for a coordinate system that has the origin in the centre of the sample
Column 2: The horizontal displacement (Uy) [mm]
Column 3: The vertical displacement (Uz) [mm]
Example of boundary conditions data:
|
Coord_Y |
UY |
UZ |
|
-94.821924 |
0.001203 |
0.000514 |
Since measured BCs are used, they are not necessarily very smooth, and even small global perturbations can create local stress concentrations, therefore damage localization.
In order to avoidany damage localisation near the upper and lower surface of the sample, it is recommended to consider in the sample’s geometry two layers of higher strength and rigidity on the upper and lower ends of the sample (Fig. 9 Undamageable area).
The full measurements of the 6 effort components will be provided and also the displacement fields for certain key moments of the test.
The given kinematic fields unity is the micrometre, and the spatial unity in mm. Forces and torques will be given as functions of time. The considered point for torques is located in the center of the upper face of the specimen (point ![]()
References
[1] Nooru-Mohamed, M.B. (1992). “Mixed-mode fracture of concrete: an experimental approach”. PhD thesis, Technische Universteit Delft
[2] AFNOR (2006). Méthodes d’essais des ciments - Partie 1 : détermination des résistances mécaniques (NF EN 196-1).
[3] R. TCS (1985) Determination of the fracture energy of mortar and concrete by means of three-point bend tests on notched beams, Materials and Structures 18 (106) 285–290
[4] Carpiuc, A. (2015). “Innovative tests for characterizingmixed-mode fracture of concrete: from pre-defined to interactive and hybrid tests”. PhD thesis, University of Paris-Saclay.
[5] Tomicevc, Z., Hild, F., and Roux, S. (2013). Mechanics-aided digital image correlation. The Journal of Strain Analysis for Engineering Design, 48(5):330–343.
[6] Lorentz, E. (2015). A nonlocal damage model for plain concrete consistent with cohesive fracture. Submitted.


